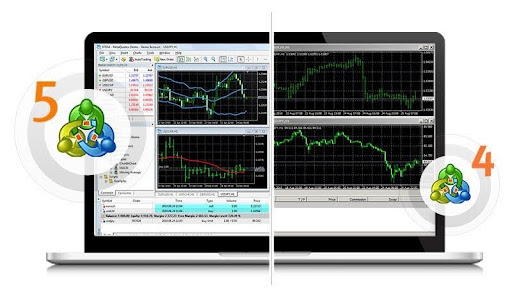
Technical analysis is at the core of many trading strategies, helping traders identify trends, reversals, and entry points based on historical price data. While some traders rely solely on price action, others use indicators and patterns to refine their decisions. MetaTrader 5 offers a comprehensive suite of tools designed to make technical analysis both accessible and precise, whether you are a beginner or an experienced trader.
Understanding Price Charts and Timeframes
Every technical analysis begins with price charts. MetaTrader 5 allows traders to switch between candlestick, bar, and line charts, each offering unique insights into market sentiment. Candlestick charts are particularly popular because they provide detailed price action information, including opening, closing, high, and low prices for a given period.
Selecting the right timeframe is equally important. Short-term traders may focus on M1 (1-minute) and M5 (5-minute) charts, while swing traders and long-term investors typically analyzeH4 (4-hour), daily, or weekly charts. Switching between multiple timeframes helps traders confirm trends and filter out noise.
Utilizing Built-in Indicators for Market Insights
Indicators are essential tools in technical analysis, helping traders confirm trends, measure momentum, and predict reversals. MetaTrader 5 includes over 80 built-in indicators, covering trend-following, oscillators, and volume-based tools.
- Moving Averages (MAs): Help smooth price data and highlight trend direction. The crossover of short-term and long-term MAs can signal entry points.
- Relative Strength Index (RSI): Measures momentum by identifying overbought and oversold conditions, often indicating potential reversals.
- MACD (Moving Average Convergence Divergence): A combination of moving averages that signals trend strength and changes in momentum.
- Bollinger Bands: Define price volatility and highlight periods of market expansion and contraction, often preceding breakouts.
Combining multiple indicators can provide stronger confirmation for trade decisions, helping traders avoid false signals.
Drawing Trendlines and Recognizing Patterns
Trendlines are one of the simplest yet most effective tools in MetaTrader 5, allowing traders to visualize market direction. Drawing an upward trendline along higher lows or a downward trendline along lower highs helps traders spot potential breakout or continuation points.
Beyond trendlines, recognizing chart patterns can provide early trade signals. Some of the most widely used patterns include:
- Head and Shoulders: Indicates potential trend reversals.
- Double Tops and Bottoms: Suggest possible price reversals at key levels.
- Triangles and Wedges: Signal consolidation phases before major breakouts.
Using MetaTrader 5’s drawing tools, traders can manually map out these patterns to anticipate future price movements.
Using Fibonacci Tools for Precision Trading
Many traders use Fibonacci retracement levels to identify potential support and resistance areas. MetaTrader 5 makes this process simple with its built-in Fibonacci tools. By drawing retracement levels from a swing high to a swing low, traders can highlight key price zones where the market may reverse or continue its trend. Common retracement levels include 38.2%, 50%, and 61.8%, often used to pinpoint ideal entry points.
Analyzing Volume and Market Depth
While price movements provide valuable information, volume plays a crucial role in confirming the strength of a trend. MetaTrader 5 offers volume indicators such as On-Balance Volume (OBV) and Volume Profile, helping traders gauge market participation. Higher volume during price breakouts often confirms the strength of the move, while weak volume may indicate a false breakout.
Additionally, the Market Depth feature in MetaTrader 5 allows traders to see real-time bid and ask prices, providing insight into liquidity and potential price levels where institutional orders may be placed.
Backtesting Strategies for Confirmation
One of the advantages of MetaTrader 5 is the ability to test technical strategies before applying them to live markets. The Strategy Tester enables traders to backtest indicators and automated strategies using historical data. By analyzing past performance, traders can refine their approach, optimize settings, and gain confidence in their chosen indicators.
Technical analysis is a skill that improves with experience, and MetaTrader 5 provides all the tools necessary to develop a structured trading approach. From customizable price charts and trend indicators to Fibonacci tools and volume analysis, traders can tailor their strategies to match their market perspective. The key to success lies in combining different tools, confirming signals across multiple timeframes, and continuously refining techniques through practice and backtesting.


